Key takeaways
- OEE is a universal metric for measuring manufacturing productivity and equipment effectiveness.
- It helps identify and reduce production losses across availability, performance, and quality.
- A perfect OEE score of 100% means you’re operating at peak performance.
- Tracking OEE reveals hidden inefficiencies and helps prioritize improvement initiatives.
- Manufacturers use OEE data to cut costs and drive continuous improvement.
If you’re responsible for keeping production running smoothly, chances are you’ve come across the term “OEE.” Short for overall equipment effectiveness, it’s one of the most powerful KPIs for measuring how well your manufacturing equipment is really performing. But getting a clear read on OEE and improving it can feel anything but simple. Whether you’re battling equipment failures, looking to reduce downtime, or just trying to get more out of your current process, OEE helps you connect the dots.
In this guide, we’ll break down how to calculate OEE, why it matters, common OEE losses, and how manufacturers use it to eliminate waste and make smarter, faster decisions.
What is overall equipment effectiveness (OEE)?
OEE is one of the clearest ways to understand how well your manufacturing equipment is actually performing. It rolls up three variables availability, performance, and quality into one percentage that tells you how much of your planned production time is truly productive.
Put simply, OEE measures whether you’re making good parts as fast as possible with as little downtime as possible. From there, you can start spotting the biggest losses, tracking progress, and launching improvement initiatives to close the gap.
The three core components of OEE
Availability
Availability is calculated by dividing the actual hours of operation by the full working shift. For instance, an asset that has an hour of planned downtime operates for a total of 7 hours in an 8-hour working shift. To calculate the asset’s availability, the organization divides 7 hours by 8 hours. Availability equals 87.5%.
Performance efficiency
Performance efficiency is calculated by multiplying the number of processed units by the ideal cycle time for each unit and then dividing by the actual operation time. For instance, a facility that produces 440 units with a 0.5-minute ideal cycle time for each unit in 420 minutes (actual operation time) has a performance efficiency rating of 52.38%.
Rate of quality products
This quantifies how many of the units produced meet the required quality standards. For example, if only 435 products out of 440 units produced are of acceptable quality, then the rate of quality products is 98.86%.
In the example above, the organization would have an OEE rating of 45.31% that is, 87.5% x 52.38% x 98.86%.
What are the benefits of tracking OEE?
When measured right, OEE becomes one of your most valuable key performance indicators. It brings clarity to how your people, equipment, and processes are performing, and where your biggest opportunities lie.
Here’s why manufacturers rely on OEE data to drive daily decisions:
- Reduce downtime at the source. Tracking availability losses and equipment downtime allows you to spot repeat issues fast, such as material shortages, slow changeovers, or surprise equipment failures, and fix them before they spiral.
- Eliminate waste and recover manufacturing time. OEE helps you pinpoint where planned production time is slipping away and improve performance accordingly.
- Improve equipment effectiveness with less guesswork. Your OEE score compares actual output against what your manufacturing equipment is capable of producing. That makes it easier to identify underperforming assets and take action.
- Increase manufacturing productivity and cut costs. Measuring OEE reveals exactly where to focus your improvement initiatives. Rather than adding more machines or people, you can optimize what you already have.
- Drive continuous improvement across your operation. From maintenance planning to daily huddles, OEE supports total productive maintenance (TPM) and lean strategies. It helps your team move from assumptions to action, anchored by real data, not gut feel.

How to calculate overall equipment effectiveness (OEE)
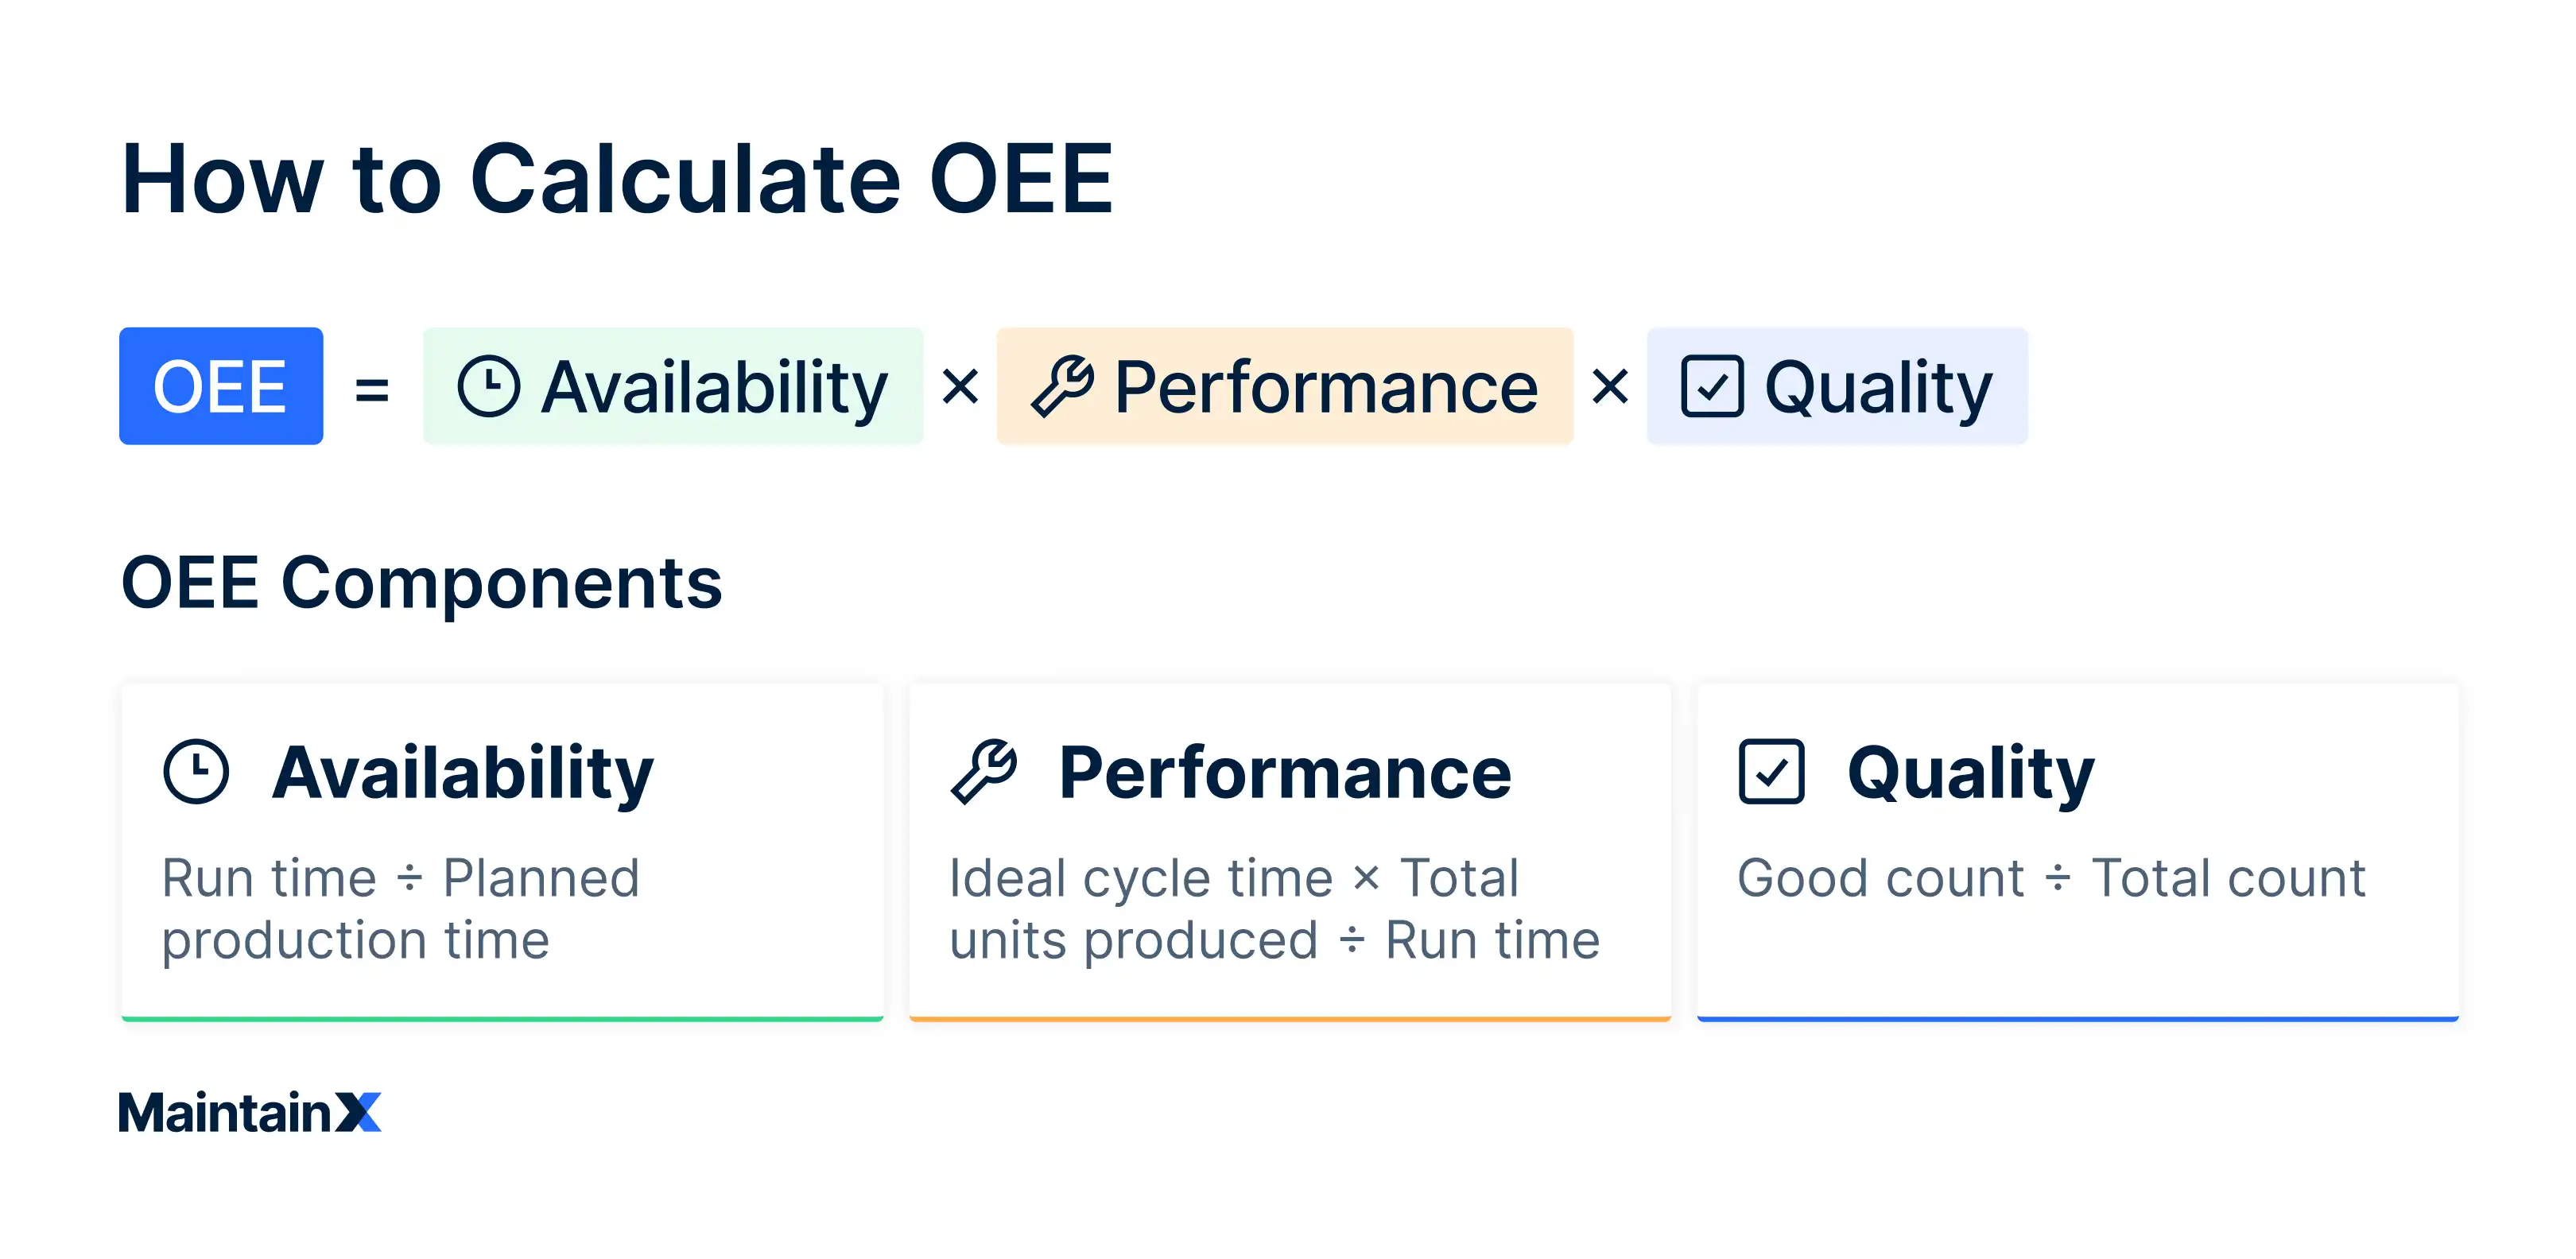
Here’s the formula at a glance:
OEE = Availability × Performance × Quality
Each of these components reflects a different type of production loss: equipment downtime, speed losses, and quality issues. Let’s break them down.
1. Availability rate
Availability shows the percentage of planned manufacturing time that your equipment is actually running. Any unplanned downtime like breakdowns, changeovers, or material shortages will bring this number down.
Formula:
Availability = Runtime ÷ Planned production time
Example:
Let’s say your manufacturing equipment is scheduled to run for 8 hours (480 minutes), but you lose 1 hour to equipment failures. That gives you 7 hours of actual run time.
Availability rate = 420 ÷ 480 = 87.5%
This availability score highlights how much manufacturing time was lost and helps you identify opportunities to reduce downtime.
2. Performance score
Performance measures whether your manufacturing equipment is running at its maximum speed during the time it’s operating. Even small speed losses like brief pauses, slow cycles, or underperforming components can erode this score.
Formula:
Performance = (Ideal cycle time × Total units produced) ÷ Runtime
Example:
Let’s say your ideal cycle time is 0.5 minutes per unit, and your facility produces 440 units in 420 minutes of runtime. Multiply 440 units by 0.5 minutes to get 220 ideal minutes.
Performance = (440 x 0.5) / 420 = 52.38%
This performance score shows how productive your equipment is relative to its maximum potential.
3. Quality
Quality represents the percentage of manufactured parts that meet your quality standards without requiring rework or scrap. If you're not consistently manufacturing only good parts, your productivity is taking a hit even if your machines are running full speed.
Formula:
Quality = Good count ÷ Total count
Example:
If 435 out of 440 parts pass quality inspection, your quality score would be:
Quality = 435 ÷ 440 = 98.86%
This quality rate reflects the effectiveness of your processes, training, and materials and signals whether improvements are needed in inspection, tooling, or setup procedures.
Putting it all together
Now that we have each score:
- Availability = 87.5%
- Performance = 52.38%
- Quality = 98.86%
Multiply them together to get your OEE score:
OEE = 0.875 × 0.5238 × 0.9886 = 0.4531 → 45.31%
That means you’re converting just over 45% of your planned manufacturing time into high-quality output at speed. The other 55% represents where the opportunity lies, whether it's reducing downtime, eliminating waste, or optimizing your production speed.
Benchmarks for overall equipment effectiveness
Besides being used as a baseline to track progress and eliminate production waste, OEE is also a benchmark for comparing the performance of given assets to other similar company assets, industry standards, and/or the results of different shifts for the same asset.
The benchmarks for OEE are:
- 100%: Production is perfect, and the facility is only producing quality goods as fast as possible without any downtime.
- 85%: A world-class rating for discrete manufacturers that produce itemized products such as automobiles, furniture, toys, and smartphones. Most organizations aim to achieve an 85% OEE rating in the long run.
- 60%: A fair rating for discrete manufacturers with opportunity for improvement.
- 40%: A low rating, but fairly common for manufacturers just beginning to track performance and take initiative to decrease downtime.


Common causes of OEE losses
By now, you know your overall equipment effectiveness (OEE) score is shaped by three components: availability, performance, and quality. But what exactly chips away at those numbers? Let's take a closer look.
Availability losses
These hit when your manufacturing equipment isn’t running during scheduled time. Think:
- Equipment failures and unexpected breakdowns
- Setup and changeovers that take too long
- Material shortages that bring everything to a halt
Availability losses are often the most visible and easiest to track and reduce with a preventive maintenance strategy and better inventory control.
Performance losses
Even when your machines are up and running, they might not be working at their best. Performance losses include:
- Slow cycles that drag down your throughput
- Minor stoppages or idling that add up across shifts
- Bottlenecks anywhere in the production flow
These issues can fly under the radar but have a real impact on your performance score. Monitoring run speeds and digging into OEE data can help you uncover what’s slowing things down.
Quality losses
Producing bad parts eats up time, materials, and morale. Quality losses include:
- Defective units that need scrapping or rework
- Start-up rejects that happen when equipment isn’t warmed up or calibrated correctly
- Rework time that should’ve been spent on productive output
Reducing quality losses is key to hitting a high OEE score and keeping your quality rate strong. If you’re not consistently manufacturing only good parts, it’s time to revisit training, materials, or SOPs.
Each of these loss categories affects a different part of the OEE calculation, but they all represent opportunities to boost equipment effectiveness.
Strategies to improve OEE in your facility
Boosting your OEE score doesn’t happen overnight, but small, targeted improvements across availability, performance, and quality can add up fast. Here’s where to start:
1. Implement preventive maintenance programs
Equipment failures are one of the quickest ways to tank your availability score. That’s why leading manufacturers lean on total productive maintenance (TPM) strategies to stay ahead of breakdowns.
2. Use real-time monitoring tools
Real-time monitoring makes it easier to track performance losses and availability issues as they happen, not hours or days later.
When data flows directly into your dashboards and analytics tools, you get instant visibility into production speed, quality rate, and equipment effectiveness. That means you can act quickly, make informed decisions, and avoid the costly ripple effects of equipment downtime.
3. Train teams on improving the right metrics
A strong OEE score starts with strong operators. Invest in regular training around OEE basics, equipment operation, and what defines a “good” product. Teaching staff how to spot the signs of performance issues and document abnormalities helps turn your front line into a first line of defense against inefficiency.
4. Analyze and optimize production processes
The best teams are constantly asking questions from their OEE data to drive continuous improvement. Questions like:
- Why does Line A consistently outperform Line B?
- What’s driving those repeat quality issues?
- Are setup times consistent across teams?
- Where are we losing the most manufacturing time?

Drive continuous improvement with OEE
Overall equipment effectiveness (OEE) isn’t just a KPI. It’s your compass for building a smarter, more resilient manufacturing operation. When tracked consistently, OEE gives you a clear picture of how your manufacturing equipment is performing across the board: where things are running smoothly, where you’re hitting friction, and where targeted improvements can unlock serious gains.
You don’t need to hit a perfect OEE score of 100 to see meaningful results. Every percentage point counts. Even small improvements in availability rate, performance efficiency, or quality score can translate into big wins in manufacturing productivity and cost reduction.
With the right tools like real-time monitoring, TPM programs, and centralized OEE data collection, you can start making data-backed decisions that improve equipment effectiveness. These tools will streamline your production process shift after shift.
Ready to take action? MaintainX gives operations and maintenance teams the visibility they need to track key performance indicators, reduce downtime, and boost manufacturing productivity at scale.
Check out our guide to starting a preventive maintenance program to build a stronger foundation for OEE improvement.
Overall equipment effectiveness (OEE) FAQs
How do you measure overall equipment effectiveness?
To calculate overall equipment effectiveness (OEE), multiply your availability rate, performance rate, and quality rate, then convert the result into a percentage.
OEE = Availability × Performance × Quality
What is a good OEE score?
A world-class OEE score is 85% or higher, meaning you’re making only good parts as fast as possible with no stops or slowdowns.
Most manufacturers land somewhere between 60% and 75% to start, which leaves plenty of room to improve equipment effectiveness and cut costs by reducing downtime.
What is the OEE formula?
There are a few ways to write it, but here’s the most straightforward version:
OEE = Availability × Performance × Quality